Gas Liquid Porometry
Gas Liquid Porometry
Bulk Porosity Measurements of Through Pores
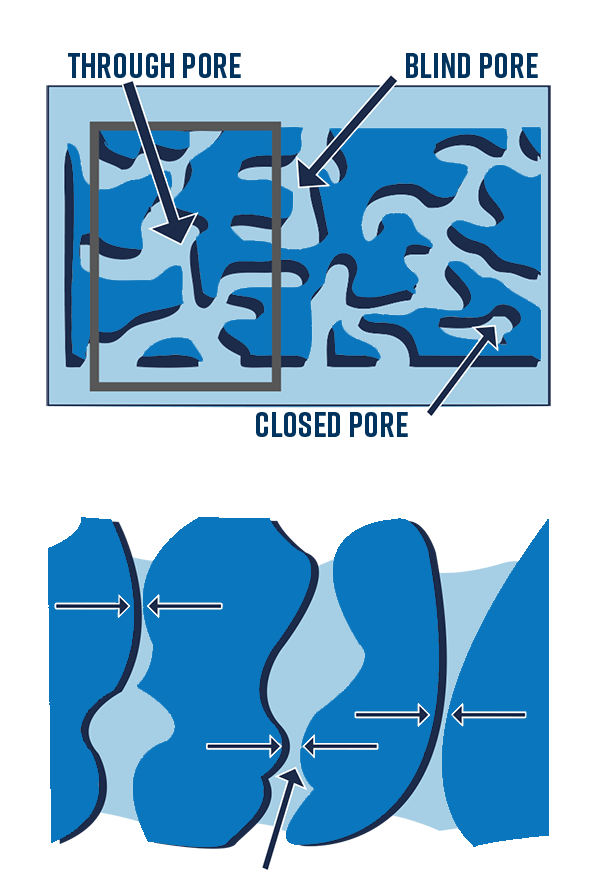
The most challenging part for the gas to displace the liquid along the entire pore path is the most constricted section, also known as a pore throat. The diameter measured in CFP is the pore throat, regardless of where it exactly in the pore path is.
Larger pores become empty first and, as the applied pressure increases, so do the smaller ones until all through pores are empty.
The most challenging part for the gas to displace the liquid along the entire pore path is the most constricted section, also known as pore throat. The diameter measured in CFP is the pore throat, regardless of where it exactly in the pore path is.
The method depends upon the capillary rise created by the surface tension between the liquid and the gas. Therefore, a wetted pore immersed in a liquid draws the liquid up the capillary until it reaches equilibrium with the force of gravity.
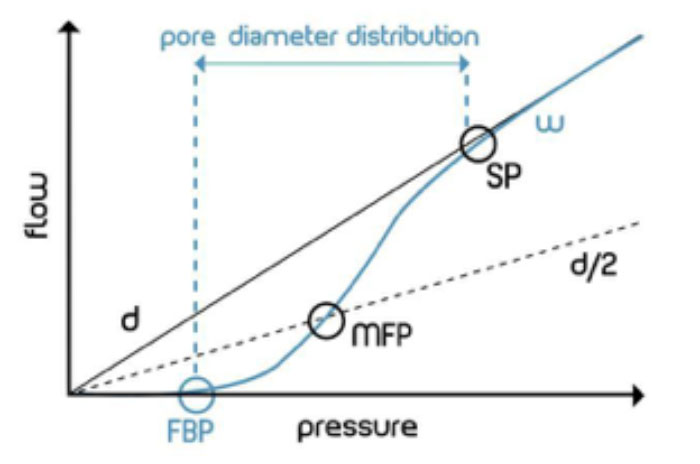
Following the wet curve, the gas flow against the applied pressure on the dry sample (“dry curve”) is also measured. From data from the wet curve, the dry curve, and the “half-dry curve” (dividing the flow values of the dry curve by 2) information about the porous network can be obtained.
Measuring curves and resulting parameters in CFP
(w = wet curve, d = dry curve, d/2 = half-dry curve, FBP = largest pore, MFP = mean flow pore, SP = smallest pore)
Standard Capabilities
Pore Characterization
- Bubble point - Maximum pore diameter
- Smallest pore size - Calculated at the pressure at which the dry curve meets the wet curve
- Mean flow pore diameter - Pore size at which 50 % of the total gas flow can be accounted for (half the flow is through pores larger than this diameter)
- Gas permeability - In the same measurement, it is possible to obtain the gas flow rate. If the material area and thickness are known, the gas permeability can also be accounted for.
Additional Capabilities
Pore Statistics & Calculations:
- Cumulative filter flow [SUM] - It shows which percentage of the flow (at the Y-axis) has passed through pores with a size larger than the value at the corresponding point at the X-axis. It is also known as filter efficiency.
- Differential filter flow [DIF] - It shows the percentage of flow (at the Y-axis), which has passed the pores with a corresponding size at the X-axis and the following size value at the same axis. According to ASTM, this graph shows the so called “pore size frequency”.
- Pore size flow distribution [CDIF] - It shows the flow distribution normalized per unit of change in size (flow changes are divided by size changes). Sometimes it is also referred to as pore size distribution.
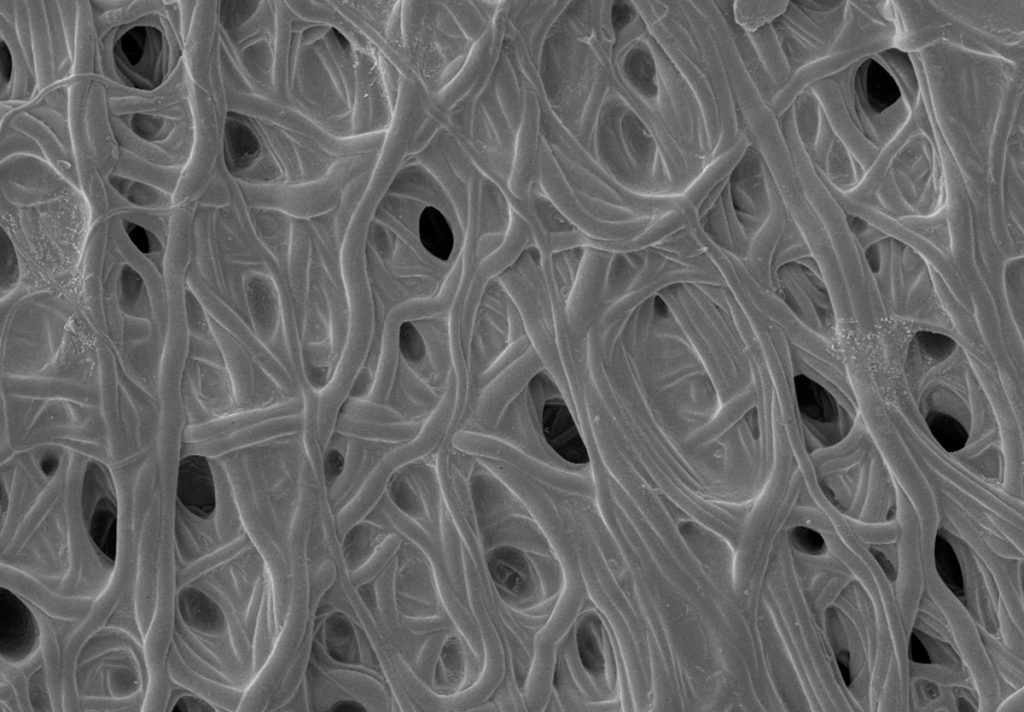
We can provide Porometry data combined with SEM pore statistics for comparison to surface pores with bulk through pores. This can be especially useful for filter materials.
Contact Us
We are a multi-disciplinary laboratory committed to providing our expertise and efficient analytical services.